DLZ and High Definition Laser Scanning:
High-definition laser scanning (HDS) has risen over the past few decades to be one of the most versatile surveying technologies available to the market. By completing a complex array of HDS projects within the heavy industry, DLZ has been proven to provide accurate and timely deliverables. This article showcases only a handful of the newest processes that DLZ is employing to provide accurate and timely deliverables while saving our clients’ money.
DLZ’s Evolution of Processing and Analysis:
Utilizing Automation
One of the major bottlenecks of working with HDS data as scan technology has evolved to greater levels of accuracy as well as gathering colored scan imagery is file size. Small HDS projects can generate dozens of gigabytes of data all the way up to large projects generating terabytes worth, straining IT infrastructure, and commanding increased time to process. While a variety of commercially available software is available to 3D models within point clouds, very few softwares offer automated extraction. With the lack of effective commercial software for point cloud analysis, DLZ has set itself apart from other engineering firms as early as 2017 by implementing customized programming to automate the most time-consuming data extraction from point clouds. This customized programming operates across multiple coding languages and software packages but has met limitations. While there is no singular data analysis software available, new software and better workflow procedures have opened new means for point cloud analysis.
DLZ’s Implementation of New Methods of Analysis
Every project comes with a unique set of challenges and needs for each client. Once the client’s needs have been identified with face-to-face on-site visits, the method and trajectory of the project are determined to meet the client’s desired goals. The variety of analysis needed can be displayed in three projects that required significantly different approaches to their analysis with unique output goals for each.
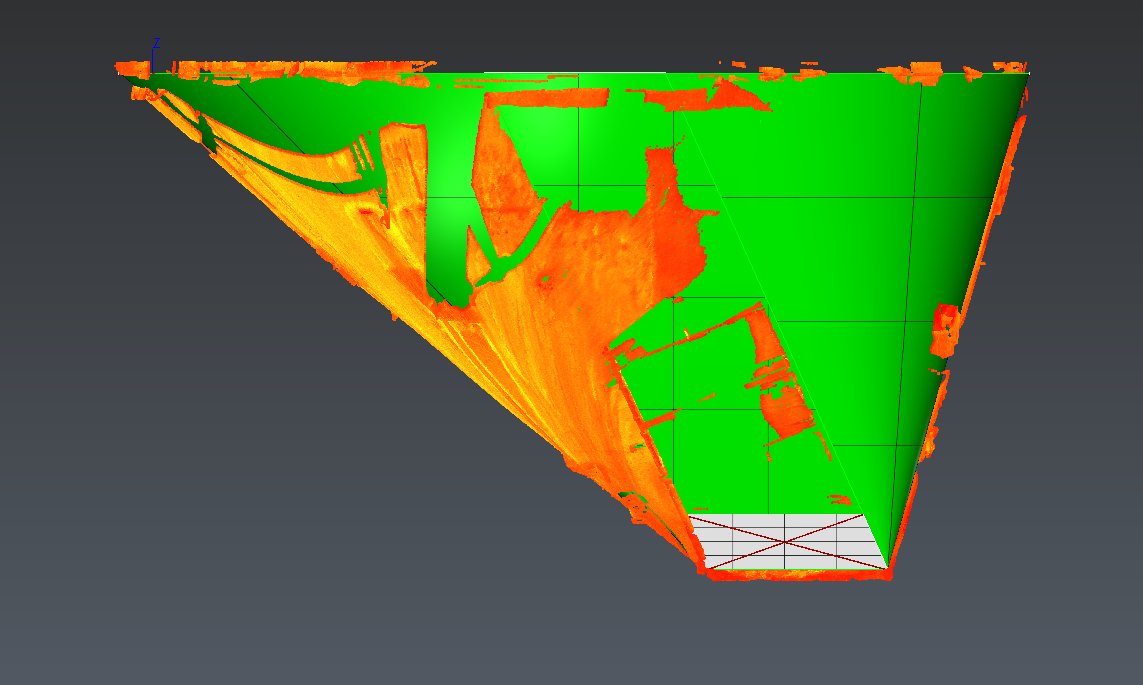
Petroleum Tank Strapping Tables – Meshed Volume
A local large-scale refinery requested DLZ to laser scan the interior of a newly finished tank and to generate strapping tables (tabularized volume by vertical increments) for this new vessel to be put into service. Existing manual methods were in place for performing this task requiring approximately 80 to 100 person-hours to complete. Using modern 3D meshing and automated data extraction, the turn-around time for the deliverable was reduced by over 80% while retaining accuracy.
Wastewater Processing Tank – Cloud-to-Best Fit model
An industrial facility processing wastewater from steel coil processing was concerned about the integrity of the aging wastewater tanks used to separate the contaminants from lake water. The interior of the vessels was scanned once the base concrete surface had been cleaned. The scan data was used to generate a best-fit model of the conical-shaped bottom to compare the condition of the concrete. Existing automation would have required 4 man-hours to write code and generate the output data. The latest automated methods completed the same task in under 1 hour, completing millions of comparisons between the point cloud and the best-fit model. This output was used to create a colorized deviation map of the cone.
Wastewater Treatment Basin – Cloud-to-Mesh
A local steel mill wanted to track the erosion on a concrete equalizing basin over concerns of excessive wear leading to leaks. The basin was scanned twice, one year between the visits, allowing the concrete to be cleaned before each visit. Current automation methods would only be able to compare deviation from best-fit surfaces, which will not account for small fluctuations in the surface. Using next-generation software and analysis methods, a mesh was generated from the point cloud data of the first visit. The point cloud of the later visit was then measured relative to this mesh, allowing comparison of the same position 1 year apart delivered to the client in colorized deviation. Analysis of this type was impossible up to this point.
Basic Oxygen Furnace (BOF) Cooling Tower – Cloud-to-CAD Model
A steel producer needed consultation on their decision as to whether or not to replace the worn BOF cooling tower at their facility. The client’s end goal was to determine the amount of distortion the structure had suffered over its service. To determine this distortion, a 3D CAD model was supplied to establish the design condition of the tower. Traditional automation required days’ worth of cleaning the point cloud due to the exceptionally crowded working space around the tower and code generation. Updated methods now allow for the client-supplied CAD model to be inserted into the point cloud and will automatically clean the cloud, only leaving the data collected on the tower itself. This cleaned data is then measured relative to the CAD model to generate a colorized deviation map for the client. This entire workflow takes hours compared to days for the old process.
DLZ on the Leading Edge:
The advancement and evolution of HDS technology require an equal evolution of post-processing capabilities. This evolution means that processes that used to take days now only take hours and allow for higher accuracy and deliverables that were not previously possible. DLZ remains on the leading edge of HDS technology adoption and adaptation of newer, more efficient methods of analyzing point cloud data. This results in data DLZ’s clients can rely on while maintaining time and budget requirements.