Posts Tagged ‘surveying’

Remote Controlled, Unmanned Boat Offers Safer Solution to Hydrographic Surveys

Water is becoming more of a precious resource every year. From the ability to handle storm runoff, store water for public and private use, manage areas for recreation, and even assist in navigation, the necessity to accurately determine water volume and depth has become a growing project requirement throughout the Midwest.

The methods survey firms use to meet these project requirements has also grown thanks to today’s technology. The days of row boats and manual sounding chains have given way to single and multi-beam echo sounders on regular watercraft and even remote-controlled watercraft – which at times is a better and safer solution.

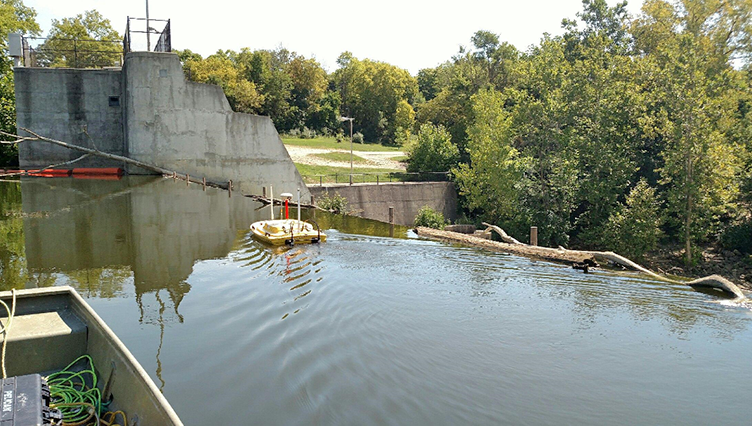
This remote-controlled method is possible thanks to Teledyne Marine’s Z-boat technology. DLZ has incorporated this technology for years. The Z-Boat performs hydrographic survey work in bodies of water where access and shallow depth can cause major issues in watercraft mobilization. It is a safe and many times faster solution in troubled waters.

The Z-Boat is approximately 3ft x 5ft, made of plastic, has two electric outboard motors and weighs 150lbs once loaded with batteries and equipment. Using dual frequency beam echo sounders to allow for readings on both hard and soft surfaces, survey data is transmitted to an on-shore field computer in real time using a radio link. Through GPS antennas and radios, field personnel can control the Z-Boat and monitor the data safely in real time.

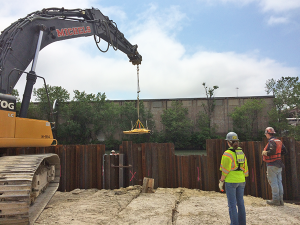
Due to its small size and large variety of potential operating environments, the Z-Boat can be placed in the water either directly with a dolly or a crane and sling, as long as the water is at least 1ft deep.

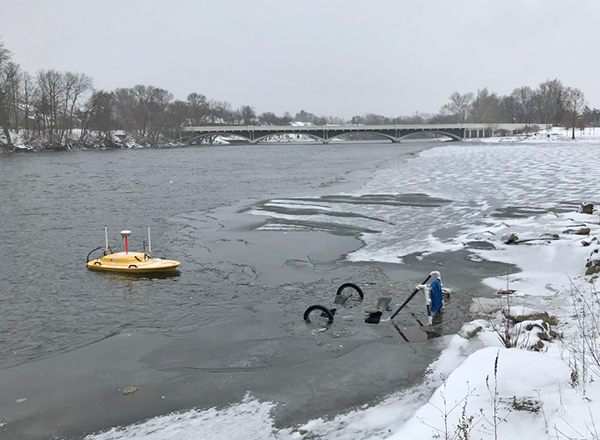
The Z-Boat is often the safest option. In shallow bodies of water with a soft sediment bottom, it can be very hazardous for a person to walk out and get stuck. In some cases, the water may be contaminated. To reduce the potential of personnel exposure to hazardous materials, DLZ uses the Z-Boat which can be/ or which is then decontaminated afterwards. The Z-Boat can go up to 6mph and is a suitable choice for fast moving streams and rivers that may be more precarious on foot or in manned vessels. At times, there may not be an appropriate location to launch a larger survey vessel, in which case the Z-Boat is again the safer option.

A versatile boat, the Z-boat can meet a range of challenging hydrographic survey environments. With the capability to survey in conditions that could be hazardous to personnel, collect quality data, and keep our employees safe, the Z-Boat positions DLZ to safely deliver cutting edge solutions to our clients’ surveying needs.

Data Analysis and Reporting Workflow Using Algorithms: A Case Study

Introducing “The Problem”
A large steel producer in Northwest Indiana (Client) recently had a legacy issue concerning one of its blast furnaces. Client noticed the furnace’s tuyeres (the holes through which air is forced into the blast furnace) were changing shape, going from cylindrical to ellipsoid. Client was concerned that the entire structure was slowly collapsing or shifting towards a point of structural failure.
To say the least, the problem was high profile.

The Call for Help
Survey crews from DLZ’s Burns Harbor office were asked to collect data on as much of the furnace’s over 100’ tall and nearly 50’ diameter shell as possible, and analyze the data in order to better understand how much the furnace was moving.

Using a Leica P40 high definition 3D laser scanner over the course of a 10-hour work day, while the furnace was shut down for routine maintenance, two DLZ survey crews were able to get a baseline set of data.

In total, the initial set of data approximated 65gb (2.5 billon) individual data points.

Analyzing the Data
The challenge was not analyzing the data a single time. The challenge was having a way to analyze the data multiple times quickly and accurately. Additionally, the furnace is subject to normal movement, and that needs to be accounted for.

Leveraging Computing Power to Process Data
After registering (the process of “stitching” together multiple sets of data) the laser scan data, the rest of the processing was turned over to a computer algorithm. The algorithm parsed the data based on a radial grid, and reduced the 2.5 billon points down to just 20,000 representative monitoring points.
A second algorithm was written to find and analyze those same 20,000 points from any subsequent dataset.

Understanding the Audience
While engineers, surveyors, and other technical-minded professionals are comfortable with, and often prefer, numbers and raw data, a set of 20,000 points is just too large to properly comprehend, and the high-profile nature of the project involved several non-technical decision makers. With these considerations in mind, the priorities for project deliverables were as follows:

  1. Visuals > Numbers
    With so many individual data points it is nearly impossible to gain an accurate understanding of the structures movement from tables and charts alone. To help this problem, a colormap was created to represent deviations with color instead of with numbers.
  2. Speed of Interpretation > Resolution of Results
    By using colors to represent deviations the reader loses the ability to know the exact deviation at any given location. The tradeoff is the reader gains the ability to interpret the entire data set quickly as colors form trends and are represented in a picture.
  3. Solution > Interpretation (in regard to communication)
    The visualizations resulted in a quick, consistent interpretation of the data by multiple readers. This allowed the focus of the group to be on solutions rather than spending a large amount of time trying to understand, interpret, or debating the meaning of the data.

Visualizing and Presenting the Results
Ultimately the project deliverables were a 2D colormap and a 3D model, which illustrated that the furnace did show both movement and change in shape, but not enough to cause concern. After only a 10-minute conversation about DLZ’s findings, the discussion was able to move to solutions, which meant the collected data had been presented in a meaningful way that the client understood.

The Project Going Forward
Based on the results of DLZ’s analysis, the client decided to continue monitoring the blast furnace bi-monthly to ensure the structure remains in a normal range of fluctuation. At the same time, various reinforcements and materials will be tested to see how they might influence the shape of the tuyeres and movement of the structure.
The client was able to choose preventative maintenance instead of expensive, unnecessary measures only because of the quick turnaround enabled by the use of algorithms over manual point cloud analysis to rapidly determine the scope of the problem.

Unexpected Takeaway
When a project’s budget starts to dwindle, billable client interactions are usually the first on the chopping block. With competition always becoming more of a factor in the bidding processing, budgets are tighter than ever. Leveraging algorithms on this project provided quick answers and freed up valuable hours to allow for early additional client interaction with more face-to-face meetings and discussions than otherwise would have been possible.